Metadata Mapper Component
What follows is a brief summary of the Automatic and Manual Metadata Mapper component of this project. A full report can be downloaded by clicking here.
Introduction
Experiment Design and Execution
Overview
In order to compare the performance of the chosen machine learning algorithms, Weka (A Java based machine learning framework) was used to train and test the selected algorithms. Training data was gathered from a variety of open access repositories and a simple Java application was then written to extract numerical features from this training data and generate the input file that is used by Weka for training and testing. Cross-validation, as well as an unseen data set were used to compare the performance of the various algorithms.
Training the machine learning algorithms
Training data was collected from various open access repositories and consisted of 32813 records. This data was sourced from 10 different repositories and care was taken to ensure that the data was representative and of a high quality.Selected algorithms
Five machine learning algorithms were selected for evaluation based on popularity and past performance in similar tasks and the default Weka parameters for these algorithms were used for testing and training. The following five algorithms were chosen:
Performance of Machine Learning Algorithms
Both cross-validation and unseen data were used to evaluate the performance of the selected algorithms. A 10 fold, 10 iteration cross-validation was performed. The unseen data consisted of 109993 records from a NRF database containing research related data.
Cross-Validation results
Table 1 shows the cross-validation performance and standard deviation of the five selected algorithms. Random Forest performed statistically better than all the other algorithms.
| Algorithm | Percentage Correct | Standard Deviation |
|---|---|---|
| Random Forest | 94.28 | 0.38 |
| J48 (C4.5 decision tree) | 93.65 | 0.37 |
| Logistic Regression | 79.04 | 0.62 |
| Artificial Neural Networks | 76.59 | 0.91 |
| Naive Bayes | 54.92 | 0.71 |
Unseen Data Classification Results
Table 2 shows the results when the trained algorithms were given unseen data (from the NRF). Once again, both Random Forest and C4.5 were the best performing algorithms, with C4.5 performing slightly better.| Algorithm | Percentage Correct |
|---|---|
| J48 (C4.5 decision tree) | 79.54 |
| Random Forest | 68.08 |
| Logistic Regression | 57.69 |
| Artificial Neural Networks | 55.59 |
| Naive Bayes | 33.91 |
UI Design
While this project aimed to take a fairly experimental approach to development and analysis, the system being developed needed to provide a front-end, Web-based, UI to access the features so that organisations such as the NRF could use it. As such, it was important to ensure that the system was developed to be of suitable quality for a production release.
Figure 1 shows the screen presented to a user that allows them to upload a CSV input file. The CSV input file uploaded via this UI is then parsed by iteratively classifying each entry. The user can also elect to save the metadata mapping for future use, or use a previously saved mapping.
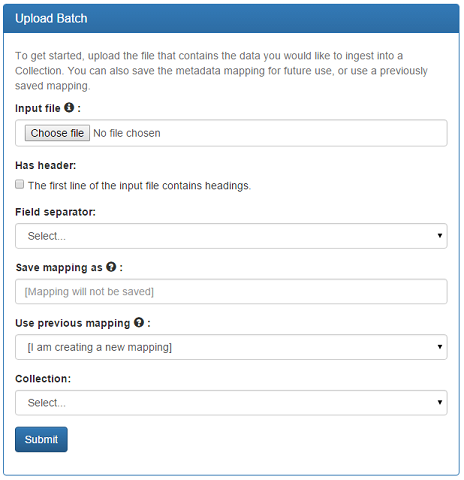
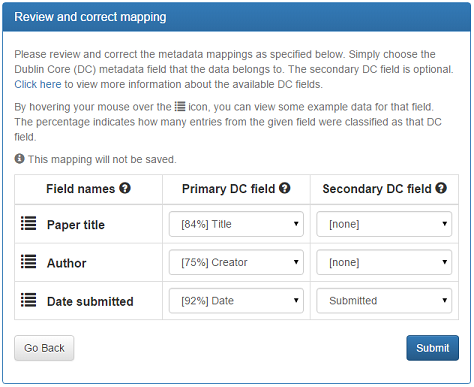
Figure 2 shows a page that contains the results of an automatic metadata mapping. Here the algorithm was able to correctly classify all three fields, with the user only having to specify the secondary field of the Dublin Core ‘date’ field. Here, 84% of the entries in the field ‘Paper title’ were correctly classified as ‘title’.
Software Usability and Acceptance
It was important that the tool being developed provided a usable and effective interface, and that it met the initial requirement of the NRF.
System Usability Testing
As the system being developed required a front-end design to interact with the system, it was imperative that the UI was easy to use and intuitive. In order to test the tool’s usability, a standard usability test was used, the System Usability Scale (SUS).
SUS was developed to try to represent the overall usability of a system through a single number, ranging from 0 to 100, with 100 being a ‘perfect’ score. The raw data, as well as the mode responses, did not appear to indicate any particular usability issues. The overall SUS scored achieved, was a very acceptable 84.
Acceptance of the Tool by the NRF
The NRF indicated that the metadata mapper met their requirements and that they were pleased with the results. They did however indicate that it would be useful if custom Dublin Core fields could be used, instead of being limited to the standard DSpace Dublin Core fields. The NRF usability survey results were positive, with the only concern being that they felt they had to learn a lot of things before using this system. The overall NRF SUS score achieved was 90.
Conclusions and Future Work
Supplementary Material
The following supplementary materials relate to those referenced in the Metadata Mapper report and are provided in the order in which they are referenced.
| Section | Document | File format |
| 1.2 - Project Aims | ||
| 1.2 - Project Aims | Excel - XLS | |
| 1.2 - Project Aims | Excel - XLS | |
| 2.1 - DSpace | ||
| 5.1.2 - Initial Requirements Survey |
Same as 1.2
|
|
| 5.3.2.1 - Initial Paper Prototype | ||
| 5.3.2.1 - Initial Paper Prototype | ||
| 5.3.3 - Testing, Documentation and Maintainability | ZIP archive | |
| 5.3.3 - Testing, Documentation and Maintainability | ZIP archive | |
| 6.1 - System Usability Testing | ||
| 6.1 - System Usability Testing | Excel - XLSX | |
| 6.3 - Acceptance of the Tool by the NRF | ||
| 6.3 - Acceptance of the Tool by the NRF | ZIP archive | |
| 6.3 - Acceptance of the Tool by the NRF | ||
| 6.3 - Acceptance of the Tool by the NRF |