Ingestion Manager and Report Writer Components
What follows is a brief summary of the Ingestion Manager and Report Writer components of this project. A full report can be downloaded by clicking here.
Requirements
Design
System Architecture
A layered architecture model is used in both the Ingestion Manger and the Report Writer. There are 4 layers in the model: storage, business services, business objects, and presentation. The layers and components of each layer of the architecture is depicted in Figure 1.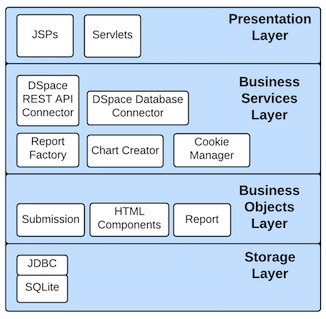
Login
DSpace requires a user to be logged in before they can submit items to the repository. The login functionality of the Ingestion Manager and Report Writer are the same. Upon loading the applications, a user is presented with a login screen. The login screen prompts the user to enter their email address and password so that they can be authenticated in the DSpace repository, as depicted in Figure 2.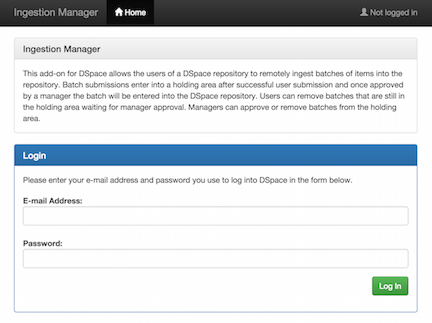
Design - Ingestion Manager
User Roles
Users of the system are separated into two categories: users and managers.Submission Workflow
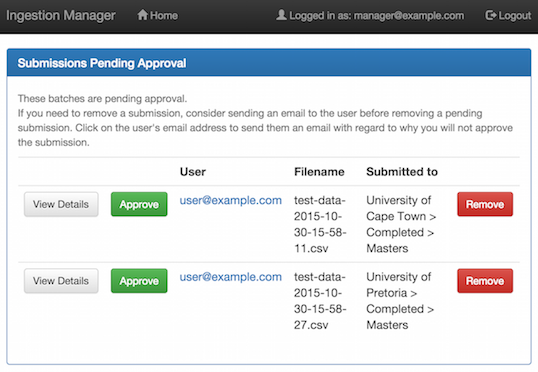
The Ingestion Manager implements a workflow-based ingestion management system, similar to that which DSpace provides, whereby a manager has to approve a user's submission before it is entered into the repository. Refer to Figure 3 for an illustration of the process of the workflow.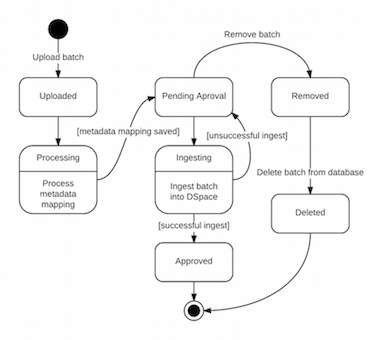
Design - Report Writer
Report Generation
The Report Writer generates reports from predefined report templates. The templates are XML files containing features which are translated to HTML components. Once logged in, a manager can select to generate a report from a list of available templates. After the report has been generated, the manager is presented with a full preview of the report. The report preview screen is depicted in Figure 6. From the preview screen, the manager can choose to download the report or return to the previous page to select another template.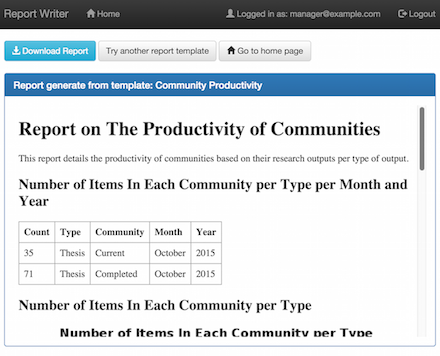
XML Template Specification
The Report Writer was designed with a similar approach to other reporting solutions. That is, the layout and content of the report is specified in an external XML file. Report features (headings, paragraphs, tables, etc.) are specified in XML tags. Some tags allow for attributes to be set for extra customization. Table 1 lists each feature available, what the XML tag should contain and its optional attributes supported by the Report Writer.Table 1: XML report feature descriptions
| Feature | Tag Value | Attributes |
|---|---|---|
| Page title | Text | |
| Heading | Text | Style (h1, h2, etc.) |
| Paragraph | Text | |
| Table | SQL SELECT query | |
| Pie chart | SQL SELECT query | Chart title, width and height. |
| Bar chart | SQL SELECT query | Chart title, width, height, x-axis and y-axis label. |
Results and Discussion
Performance Testing
Performance testing was conducted on both applications to determine whether the performance of the application degraded as the amount of work increased.Usability Testing
Usability testing was conducted to evaluate the usability of the applications we had developed. We used the System Usability Scale (SUS) designed by John Brooke as our usability questionnaire [1].User Acceptance Testing
For our user acceptance test, we created a document which listed the functional requirements that we initially proposed to our client. With each functional requirement was the option to accept or reject it based on whether we had met the requirement.Ingestion Manager
Performance Testing
The performance testing of the Ingestion Manager involved ingesting large batches of items. Batch sizes ranged from 500 to 3000 lines and increased in steps of 500, but the metadata fields remained constant. An error in the DSpace source code was identified during performance testing. To account for this error, the time required to ingest each line was recorded and if the ingestion failed the time spent on that line would be added to a cumulative total. This cumulative total was called the “time for errors” and is the amount of time a particular batch spent handling errors. The number of errors that occurred per batch was also recorded. The results of the performance test for the Ingestion Manager show an approximately linear increase in the average amount of time it took to ingest a batch into DSpace. In Figure 7 (a), the darker line plots the average total amount of time the batch took to ingest while the lighter line plots the average total amount of time that was spent handling errors. In Figure 7 (b), the average number of errors that occurred during each ingestion also shows an approximately linear increase. The results of the performance test of the Ingestion Manager show that, on average, there is no degradation in performance as the size of the batch increases.Usability Testing
The Ingestion Manager achieved a SUS score of 84. Overall, it scored a very good result in terms of usability.User Acceptance Testing
Our client accepted that we had met all the functional requirements of the Ingestion Manager that we had set out to meet.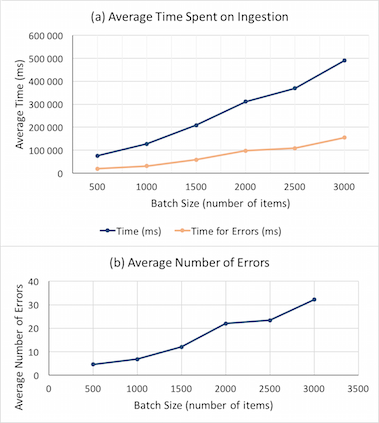
Report Writer
Performance Testing
The performance testing of the Report Writer involved recording the amount of time that it takes to generate a report depending on the number of items in the DSpace repository. The results of the performance test for the Report Writer are presented in Figure 8. The scale for both axes in Figure 8 are logarithmic and the graph depicts an exponential increase in the average time taken to generate a report on all items in the repository as the size of the repository increases. To understand why the performance degraded so drastically a further test was done, but this time the report being generated was changed to a much simpler report. This report showed a large improvement in performance when compared to the first test. For a repository size of 100,000 items, the report took on average 1,547 milliseconds to generate. From these two tests we now know that the performance of the Report Writer is largely dependant on the complexity of the report being generated.Usability Testing
The Report Writer achieved a SUS score of 90. Overall, it scored an excellent result in terms of usability.User Acceptance Testing
Our client accepted that we had met all the functional requirements of the Report Writer that we had set out to meet.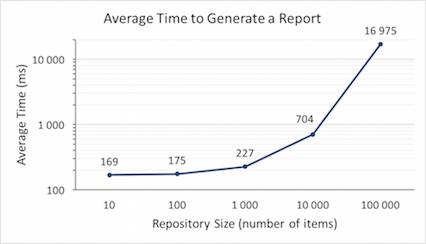
References
- Brooke, J. SUS: A “quick and dirty” usability scale. In Jordan, P. W., Homas, B. T., Weerdmeester, B.A., Clellan, I. L. M. Ed. Usability Evaluation in Industry, Taylor & Francis, London, 1996, 189-194.
Supplementary Material
| Section | File Format | Document |
| 3.1.3 User Survey | Excel - XLS | |
| 3.1.3 User Survey | Excel - XLS | |
| 3.1.4 User Cases | ||
| 3.1.4 User Cases | ||
| 3.1.4 User Cases | ||
| 3.2.7 User Interface Design | ||
| 3.2.7 User Interface Design | ||
| 4.2.2 Scrum Board | ||
| 5.2 User Evaluation | ||
| 5.2 User Evaluation | ||
| 5.2 User Evaluation | ||
| 5.5 User Acceptance Testing | ||
| 6.1 Usability Testing | ||
| 6.1 Usability Testing | ||
| 6.1 Usability Testing | Excel - XLSX | |
| 6.1 Usability Testing | Excel - XLSX | |
| 6.2 Performance Testing | Excel - XLSX |