Geospatial Visualisation

Background and Context

Previous research on National Research and Education Networks (NRENs) in Africa has shown high latency in traffic exchanged between networks, with 75% of this traffic taking circuitous routes through Europe. Possible reasons for this high latency is lack of peering relationships between NRENs. Peering is when different Internet Service Providers (ISPs) exchange data between their networks at an Internet Exhange Point (IXP).

Despite an increase in the establishment of national IXPs in Africa, high latencies still occur indicating a need for further research into the network topology of NRENs. The collection of traceroute data for logical topology discovery is therefore necessary in order to understand the underlying topology of African NRENs. Traceroute is a network diagnostic tool used to determine end-to-end paths of network packets where round trip times are relayed at each router hop.

For this reason, a visualisation would be useful in identifying possible routes that network traffic traverses between NRENs and aid in the peering decision-making process. As location is an important aspect in determining this information, a geospatial visualisation has been identified as being appropriate. A geospatial visualisation is one in which nodes are represented in respect to physical locations.

The creation and design of a geospatial visualisation is presented showing the network structure of African NRENs using traceroute data for network topology discovery.

Research Question

The following research question has been formulated for the project:

Can a geospatial visualisation effectively and accurately communicate the network topology of African NRENs, allowing users to:
  • identify networks (physical and logical),
  • where they connect (location of source, destination and intermediate hops)
  • and potential routes of traffic traversal (traceroute paths at a country and continent level)?
  • Approach

    A User-Centred Design (UCD) approach was used to develop the visualisation. UCD describes a process where the user is involved throughout the design cycle to determine user needs and goals. In context of a visualisation, this would be gaining an understanding of the initial visual queries (an information need addressed by a visualisation) that potential users may have.

    Users of the visualisation are envisaged to be NREN managers and network engineers of related tertiary education institutions of the UbuntuNet Alliance.

    The design process consists of three phases (Figure 1):

    1. the early envisioning phase
    2. the global specification phase
    3. the detailed specification phase
    In each phase, analysis, design and evaluation were conducted.

    Iteration of the design cycle is concluded once a specific criteria has been reached - such as if users are able to adequately answer visual queries. Two iterations were conducted (early envisioning and global speciffication phases) before the final visualisation was designed.

    Figure 1: User Centred Design Approach from Wassink et al., 2009

    Initial Visualisation Design

    An interactive prototype (Figure 2) with limited functionality was produced using the Google Maps Javascript API v3 and a small sample of traceroute data collected from the Ripe Atlas platform. The MaxMind GeoLite City Database was used to map IP addresses to coordinates on a city level and used to position markers on the map for both probes and destination IP addresses.

    Map Symbols

    • Destination IPs: Blue Circles
    • NREN Probes: Red Markers
    • University Probes: Purple Markers
    • Traceroute: Line with animated arrow joining destination IP icon and probes
    • Undersea fibre cables: Coloured lines around Africa where thickness of line represents capacity (GB)

    An informal user feedback evaluation was conducted with the expert user group to get feedback on the visualisation. Users had differing opinions on the undersea fibre overlay surrounding Africa: one user thought the multiple lines and colours in the overlay added too much noise to the visualisation and should be removed while another thought it was useful to perhaps reason which cable was taken by the traceroute to the destination.

    Figure 2: Screenshot of Initial Interactive Prototype

    Final Visualisation Design

    Figure 3 shows the final visualisation design based on information received in both the first and second iteration. In addition to the Google Maps Javascript API, the DataTable, javascript table plug-in for jQuery was used.

    Several dimensions of data are displayed in the visualisation including the location of Internet Exchange Points, physical fibre cables and the traceroute information collected. IXP data was obtained from Packet Clearing House's Internet exchange point directory and fibre data from Steve Song at afterfibre.net. The visualisation allows for viewing multiple traceroutes sent from various vantage points to be seen on the map all at once

    The left-hand side of the screen shows an interactive map which supports panning and zooming using the mouse. On the right-hand side of the screen, a table with contextual information related to the map can be seen. The search bar above the table on the right-hand side of the screen can be used to perform searches on the table for any column. Clicking on a particular row in the table, allows the map to zoom in to the location of the related icon on the map.

    Map Layers and Symbols

    Below the map, there are several checkboxes which can be used to toggle various map layers on and off - either displaying or hiding icons and layers on the map.

    • Destination IP Address - where a traceroute is sent to (coloured circle)
    • Probe - where a traceroute is sent from (blue diamond)
    • Internet Exchange Point (pink triangle)
    • Traceroute Hops - (bright green circle)
    • Terrestrial Fibre - Fibre Optic Cables over land (green lines)

    By default, all destination IPs are shown on the map. With the exception of hops, mousing over each symbol displays information about that particular icon such as the name, ASN and IP Address.

    Summary of Interactions

    • To view all traceroute measurements to a particular destination (Figure 4): Click on a chosen destination IP icon on the map. This will display traceroute measurements from all available probes to that particular destination. All probes, the destination IP and intermediate hops are shown on the map. A list of all the probes and related information (Probe ID, ASN, NREN/organisation name) is then shown in the table.
    • To view a single traceroute measurement from a particular probe to a particular destination (Figure 5): Click a chosen probe icon on the map. This will display the traceroute from the chosen probe to the chosen destination. The traceroute information is then shown in the table (Hop Number, Country, IP Address, RTT).
    • To select a different IP address: Click the same destination IP icon you previously selected. All destination IP addresses will be visible on the map again.

    Figure 3: Initial Overview Screen

    Figure 4: View multiple traceroutes to selected destination IP address

    Figure 5: View a single traceroute to a selcted destination IP address

    Evaluation

    Usability tests were conducted to evaluate the visualisation in terms of effectiveness, accuracy and usability. Effectiveness and accuracy were measured using the metric of successful task completion while usability was measured using the System Usability Scale (SUS) questionnaire. Usability tests were conducted with a total of 23 users where users were required to answer 10 questions using the visualisation. These usability tests last approximately 30-40 mins in an uncontrolled environment of the Computer Science Honours labs.

    Users consisted of 2nd year, 3rd year and honours Computer Science Students.

    Ethical clearance was obtained from the Science Faculty Research Ethics Committee and the Department of Student Affairs.Before taking part in the usability test, participants were asked to sign a consent form informing them of the anonymity of their results. On completion of the usability study, users were compensated for their time with a standard hourly fee as specified by the Department.

    Of the 10 questions formulated for the usability test - 4 were based on answering visual queries (Table 1) and 6, on completing composite tasks.


    Table 1: Mapping of Visual Queries to Research Question Themes

    Visual Query Visual Query Type Research Question Theme
    Which country on the African continent has the most fibre? Physical Network: Most Fibre Cable Network topology; identification of physical network
    What is the route for the traceroute between institution A and institution B? Route of Traceroute: Country level Identification of potential routes of traffic traversal; where networks connect (source, destination and intermediate hops)
    Does the route for a traceroute from institution A to institution B travel intracontinentally (within the continent)? Route of Traceroute: Intracontinental Level Identification of potential routes of traffic traversal; where networks connect (source, destination and intermediate hops)
    Does the route for a tracereoute from institution A to institution B travel intercontinentally (to a different continent)? Route of Traceroute: Intercontinental Level Identification of potential routes of traffic traversal; where networks connect (source, destination and intermediate hops)

    Free-response questions were added to the SUS questionnaire to evaluate user experience along with usability. These consisted of a field for “General Comments” (where users’ reactions, opinions and problems encountered could be described), “What features were useful?” (to determine commonly used features) and “What features are missing?” (to elicit overlooked requirements). This information was collected making use of a Google Form.

    Results

    Results from the usability test are summarised below.

    For more detailed analysis of results, please refer to the final paper.

    Visual Queries and Successful Task Completion

    Successful task completion is characterised by the ability of a participant to obtain specific data when carrying out a task. If a question was answered correctly by a participant in the question set, then the task was deemed to have been successfully completed. This same definition applied to the accuracy of answering visual queries. Due to error in question design, some tasks were designated to be partially completed if users were able to correctly one aspect of a question.

    Figure 6 presents the percentage of the four visual queries answered correctly during the usability test. 
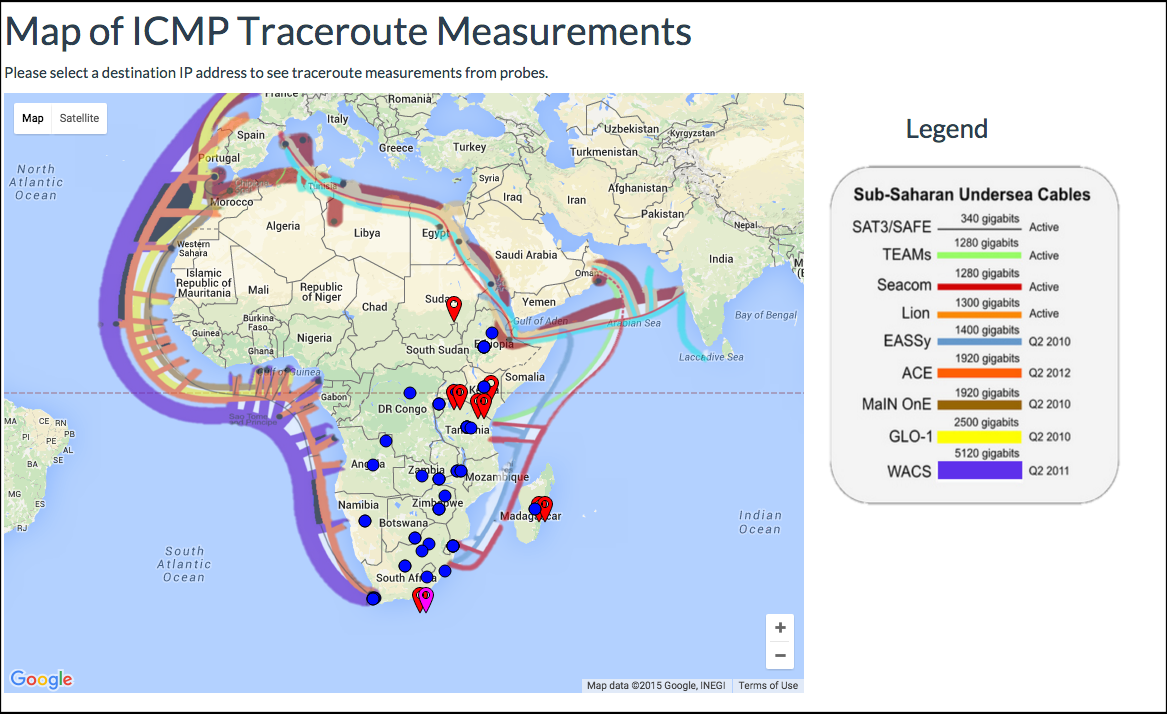
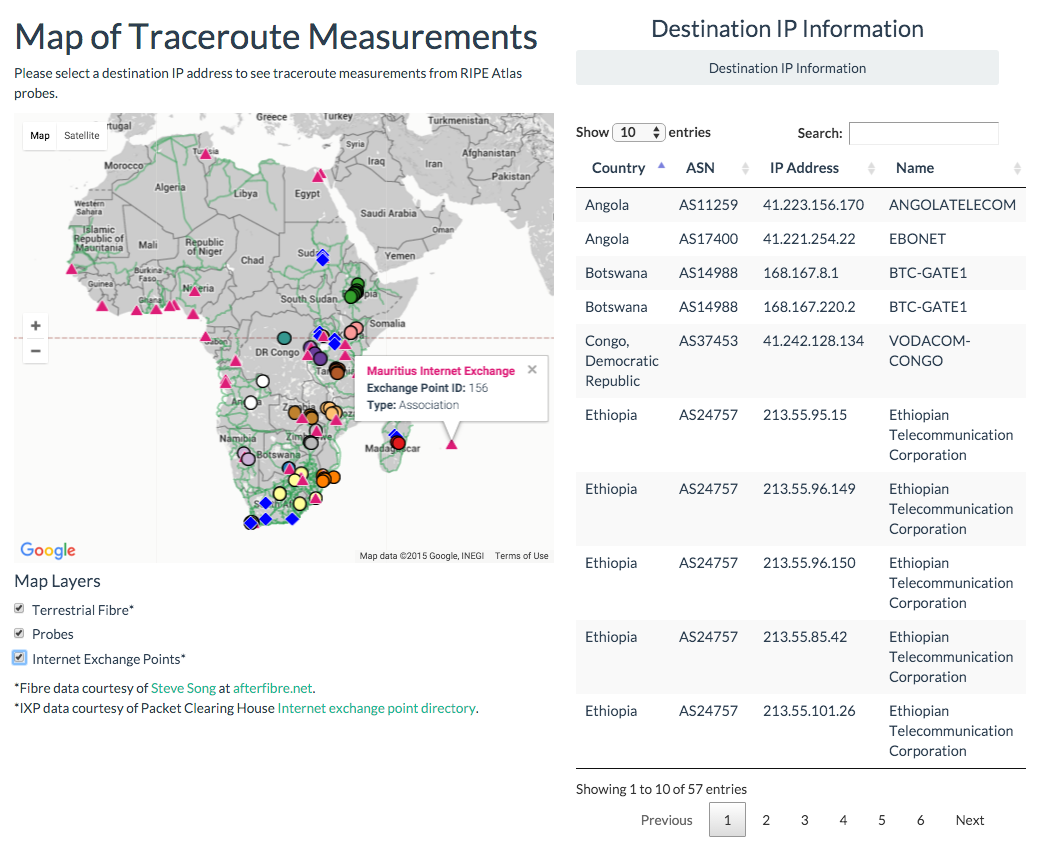
Results showed that participants were able to view the physical topology in the visualisation and based on the representation used, correctly determine the country with the most fibre cables with 100% accuracy (Figure 6). Visual queries related to routes were answered with less accuracy: identification of a traceroute’s route on a country level had 72.73% accuracy; 68.18% accuracy on an intracontinental (within the continent) level and intercontinental (between continents) level.

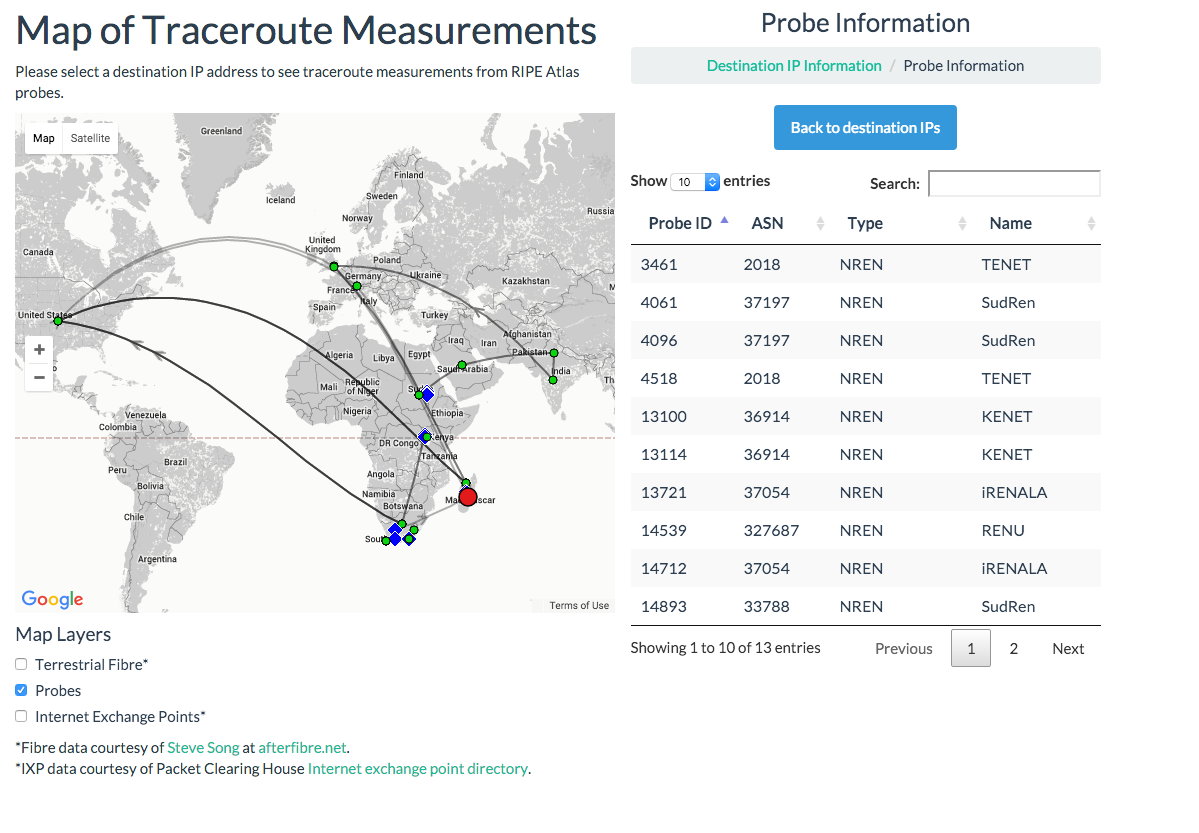
    Figure 7 shows the percentage of the six tasks successfully or partially completed during the usability test. Both Task 1 (locating the ID of an IXP) and Task 2 (locating the country of a particular IP address) had 100% successful task completion. In comparison to these tasks, Tasks 3,4,5 and 6 had lower successful task completion rates. This is understandable though as Tasks 3,4,5 and 6 were tasks that required more complex subtasks to be performed thus increasing the the likelihood of an error.

    Usability

    Figure 8 presents the frequency of System Usability Scores by category for 23 users who participated in the usability test and a pilot usability test by an expert user. The scores shown are for a total of 24 participants.

    The average SUS score was then calculated for the visualisation: 67.82.

    In an analysis of 500 studies making use of the SUS, the average score was found to be 68. Thus, the visualisation falls just below the average score where 12 out of a total of 24 respondents scored the visualisation greater than the average of 68.

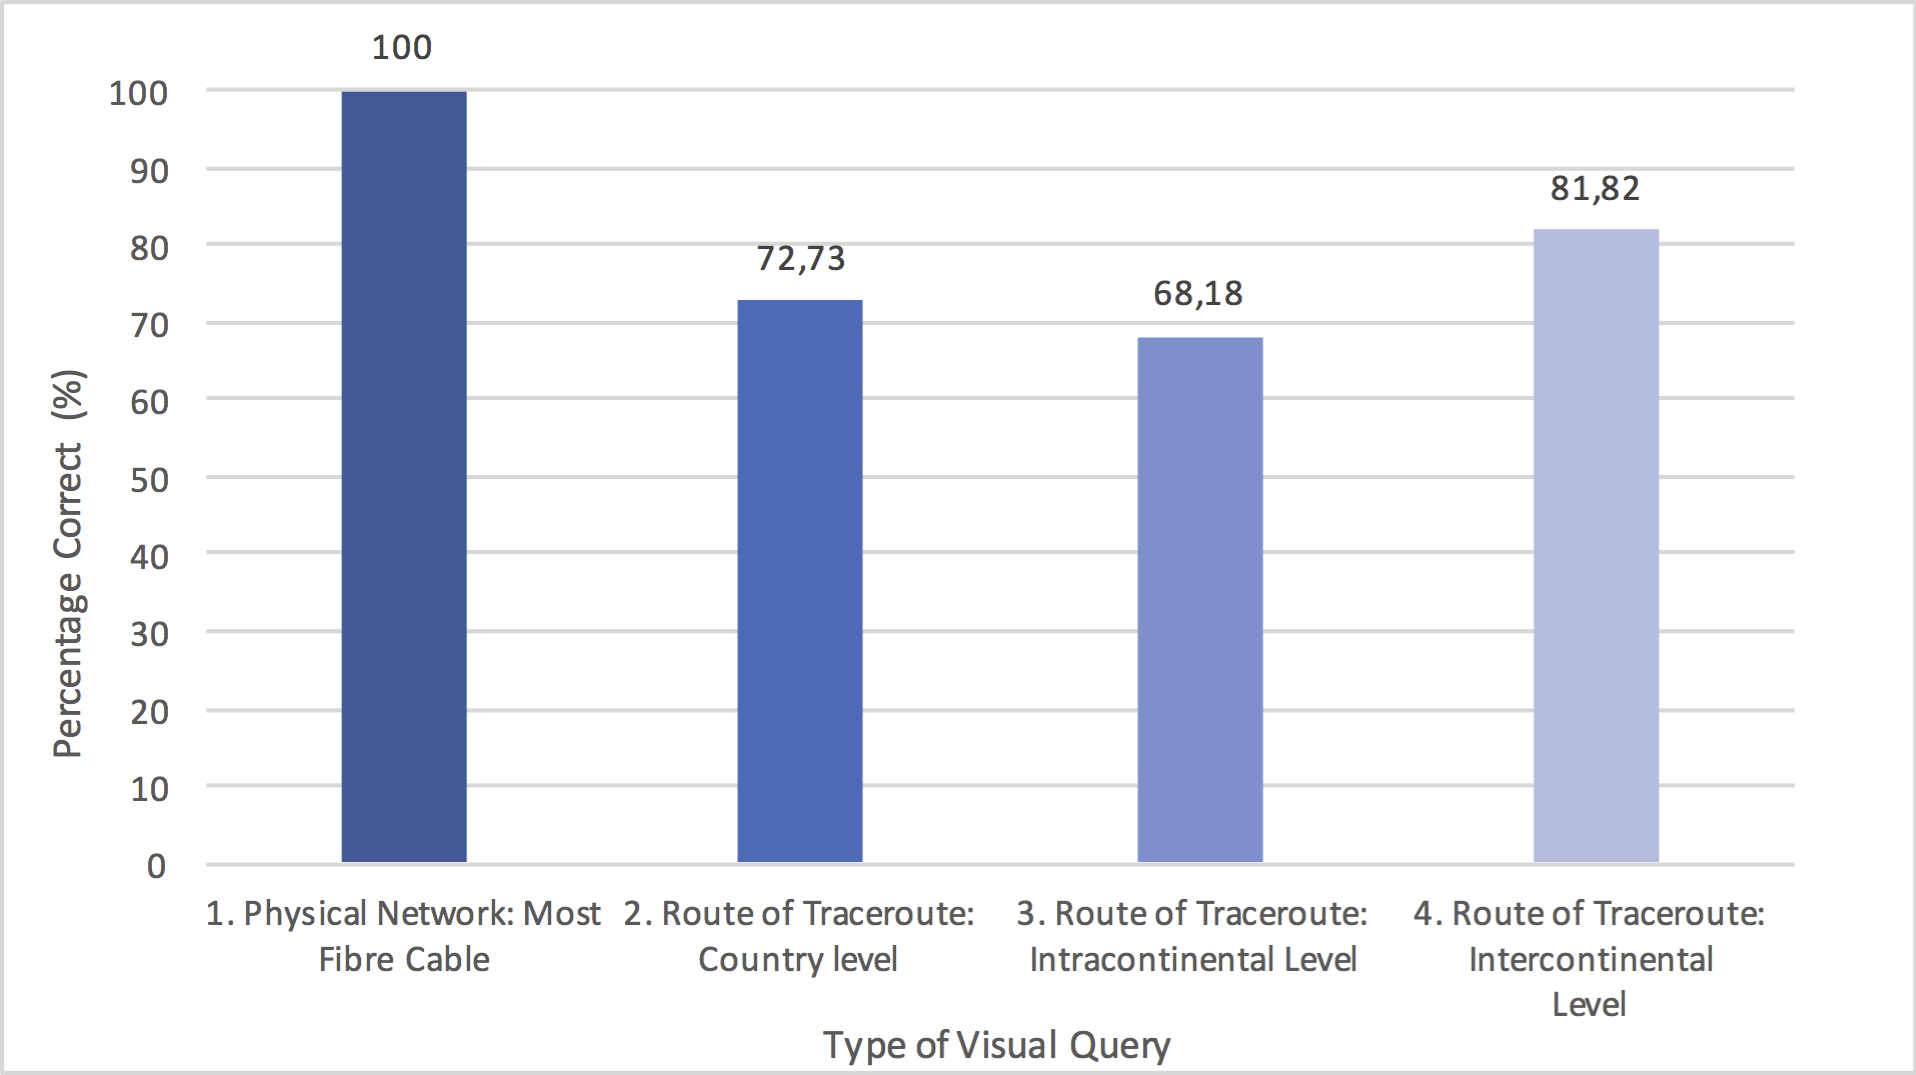
    Figure 6: Visual Queries Answered

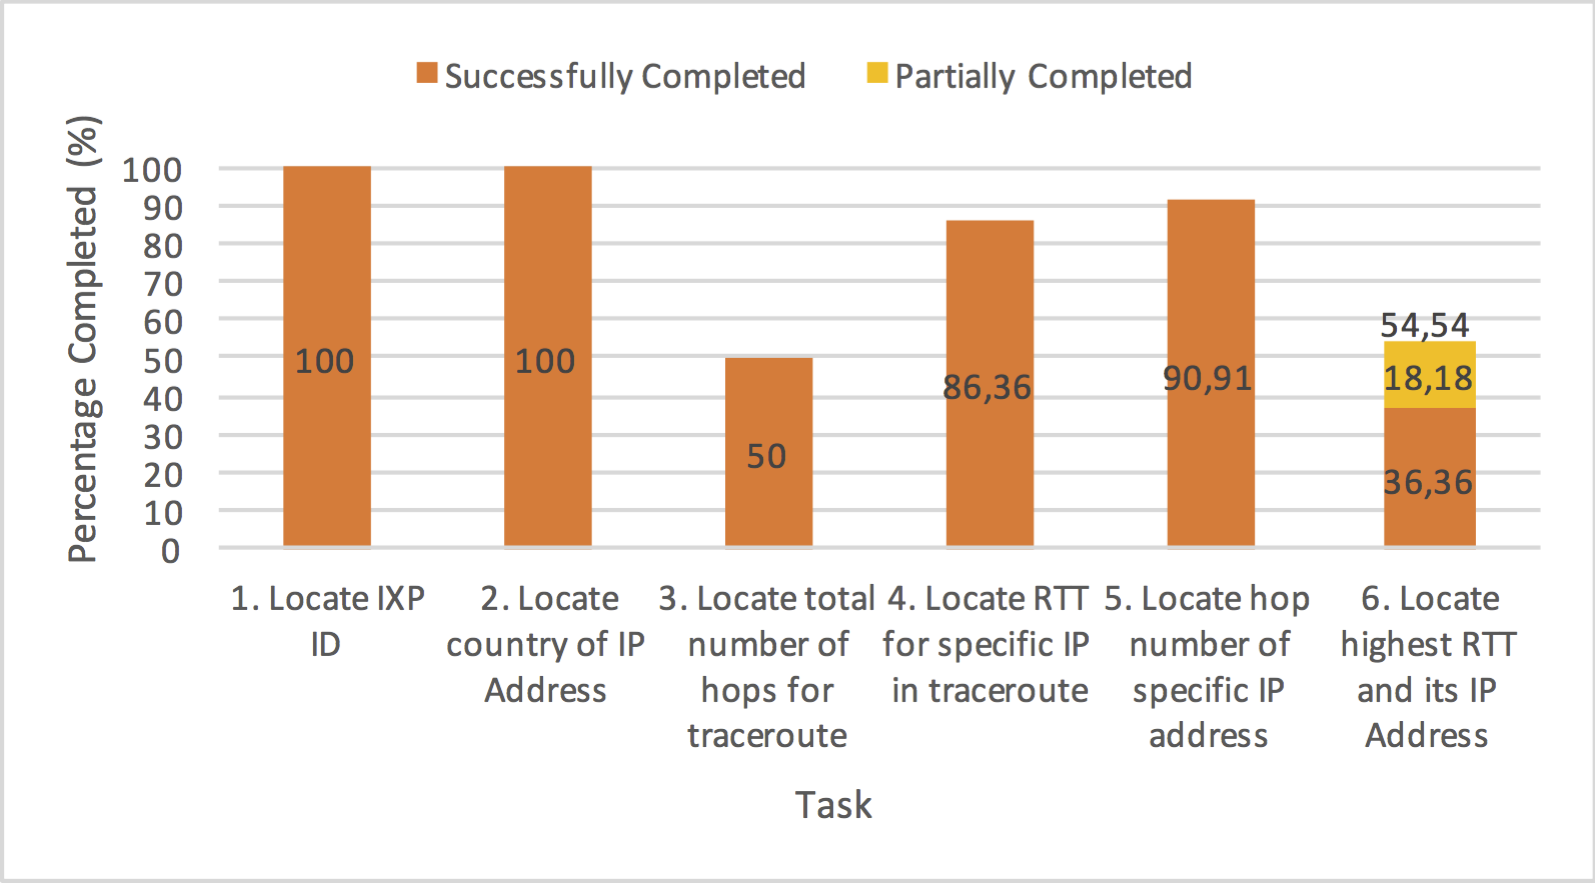
    Figure 7: Successful Task Completion

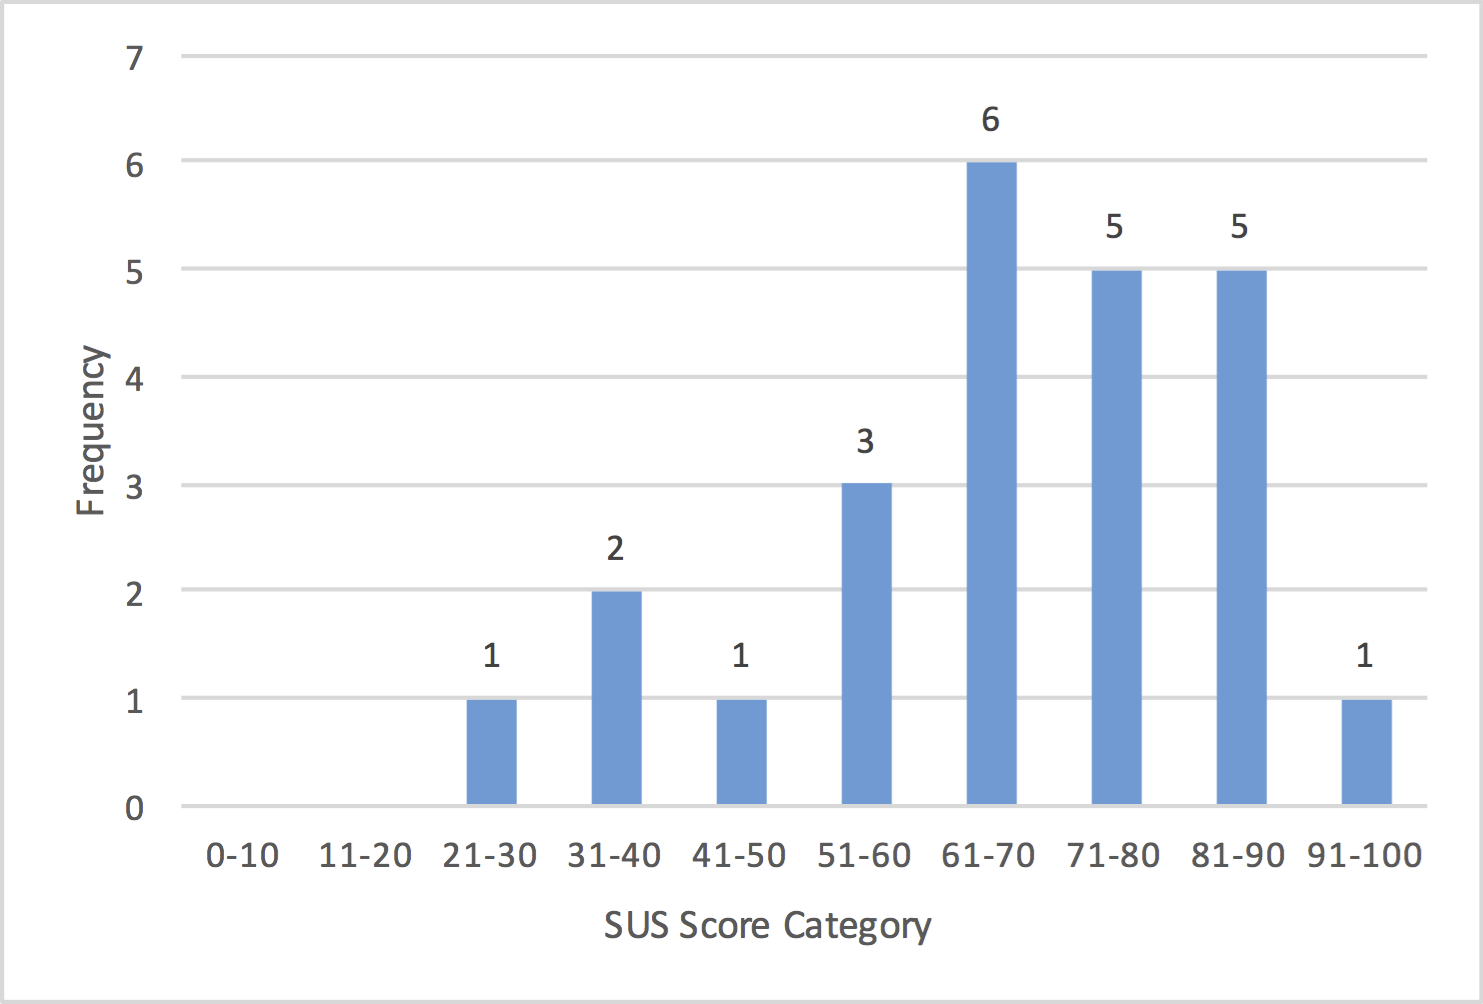
    Figure 8: Frequency of individual SUS scores by category

    Downloads


    Download Final Paper Download Literature Review

    Chantal Yang 2015