Topology Discovery for African NRENs

A National and Research and Education Network (NREN) is a mesh of interconnected networks that support the needs of education and research communities in a country. The UbuntuNet Alliance is an association of NRENs in Southern and Eastern Africa. NRENs aim to reduce latencies between educational institutions in order to facilitate better research and communication. However, it has been found that about 75% of the Internet traffic between NRENs in Africa is routed outside the continent resulting in high latencies.

There is a need for a platform which collects and displays accurate data about NREN topologies in Africa. This platform will help future researchers to see which networks exchange data circuitously and evaluate how and where networks can be improved. It will also add to the discussion and argument for why more local peering could be beneficial to African networks.

The paper below aims to find out:

Can Traceroute data be collected reliably and efficiently for the purpose of discovering the topology of African NRENs?

By “reliably”, it is meant to increase the accuracy of these measurements and ensure that the topology discovered is complete. A topology is complete if all the paths defining that topology have been found. By “efficiently”, it is meant to reduce the number of measurements to perform for obtaining a complete topology.

Methodology

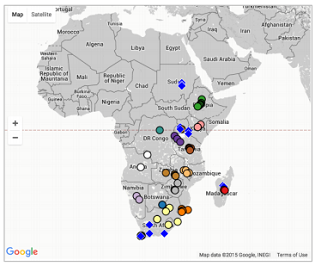
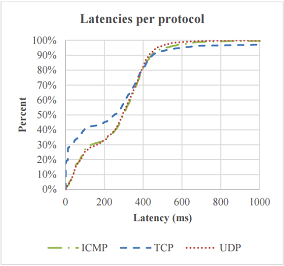
Using the RIPE Atlas platform, Traceroute measurements were conducted from 12 vantage points to 50 destination IP addresses within the UbuntuNet Alliance as displayed in Figure 1. Probes are represented by blue diamonds while destinations are represented by circles. The protocols ICMP, TCP and UDP were used. Since some protocols are blocked by firewalls on routers, all three protocols were used to discover the most complete topology.

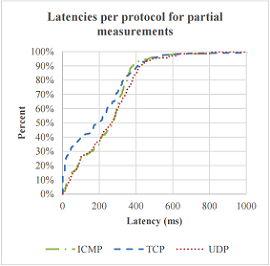
The experiment was initially run three times in an attempt to find as many paths as possible from each source to each destination. Routing and load balancing can provide a diverse set of paths depending on the congestion of the network and how packets were subsequently routed at a particular time, which is why the experiment was run more than once. Three full measurements were conducted from each probe to each target IP address using each of the three protocols. The paths of these measurements were analysed to find overlaps. Once this had been completed, three more sets of Traceroute measurements were run for each protocol where first hops and last hops were changed where necessary.

A summary of the main findings are presented below. For a full discussion of these results as well as conclusions drawn, please consult the full report at the bottom of this page.

Figure 1. Visualisation of probes and destinations for Traceroute measurements

Results

Destinations reached

As seen in Figure 2 to the right, out of the three protocols, measurements configured with TCP reached the destination most often. This clearly indicates that measurements configured with TCP had the highest reachability in terms of number of measurements which reached a destination

Out of the fifty target destinations that were probed, all of the destinations were reached by at least one probe. TCP-based measurements reached all of the destinations

Figure 2. Graph showing spread of measurements that reached their destination by protocol as a percentage of all measurements

Path Diversity

When there is more than one unique path from a source to a destination, there is path diversity. Path diversity can be expressed as the average number of unique paths between a source and a destination.

As can be seen in Figure 3 to the right, the average path diversity for TCP-based measurements is the lowest at about 1.7. ICMP-based measurements have the next highest path diversity at almost 2. UDP-based measurements have the highest path diversity at about 2.4.

It is also interesting to note that there is an increase in path discovery when new protocols are added. As seen in Figure 4 to the far right, there is an overlap in unique paths between the three protocols.

UDP-based measurements revealed the most unique paths. UDP-based measurements have the highest path diversity as well as the highest number of unique paths.

With respect to efficiency, on comparing the number of hops for full measurements and partial measurements, it was found that there was an average reduction of ten hops after modifying the first and/or last hop in the Traceroute measurement. There was therefore a reduction in probe packets.

Figure 3. Cumulative Distribution Frequency graphs for number of unique paths per protocol
Figure 4. Venn diagram showing the overlap in the number of unique paths per protocol

Latencies

When comparing Figures 5 and 6, it can be seen that the curves follow a similar trend. This indicates that the alterations in the Traceroute measurements did not have a significant effect on the results.

Figure 5. Cumulative Distribution Frequency graph showing distribution of latencies per protocol for full measurements
Figure 6. Cumulative Distribution Frequency graphs showing distribution of latencies for partial measurements where first and/or last hops were altered

Full Report and Literature Review

Final Project Paper - Roslyn Sanby

Topology Discovery for African NRENs

Literature Review - Roslyn Sanby

Analysing and Visualising National Research and Education Networks in Africa: A Literature Review