- Multiple 3D representations including PaperChain
- Identification of residues
- PDB file compatible
- In-app molecule web-search
About

In the study of carbohydrates the investigation of structure is an important aspect. Carbohydrates are complex and varied, being able to quickly identify subtle structural aspects, such as puckering, is thus very useful. More complex carbohydrates (polysaccharides) are comprised of monosaccharides, these monosaccharides not only form the structure of the polysaccharide but also determine its properties. Thus the identification, and easy recognition, of monosaccharides is important and useful to viewers.
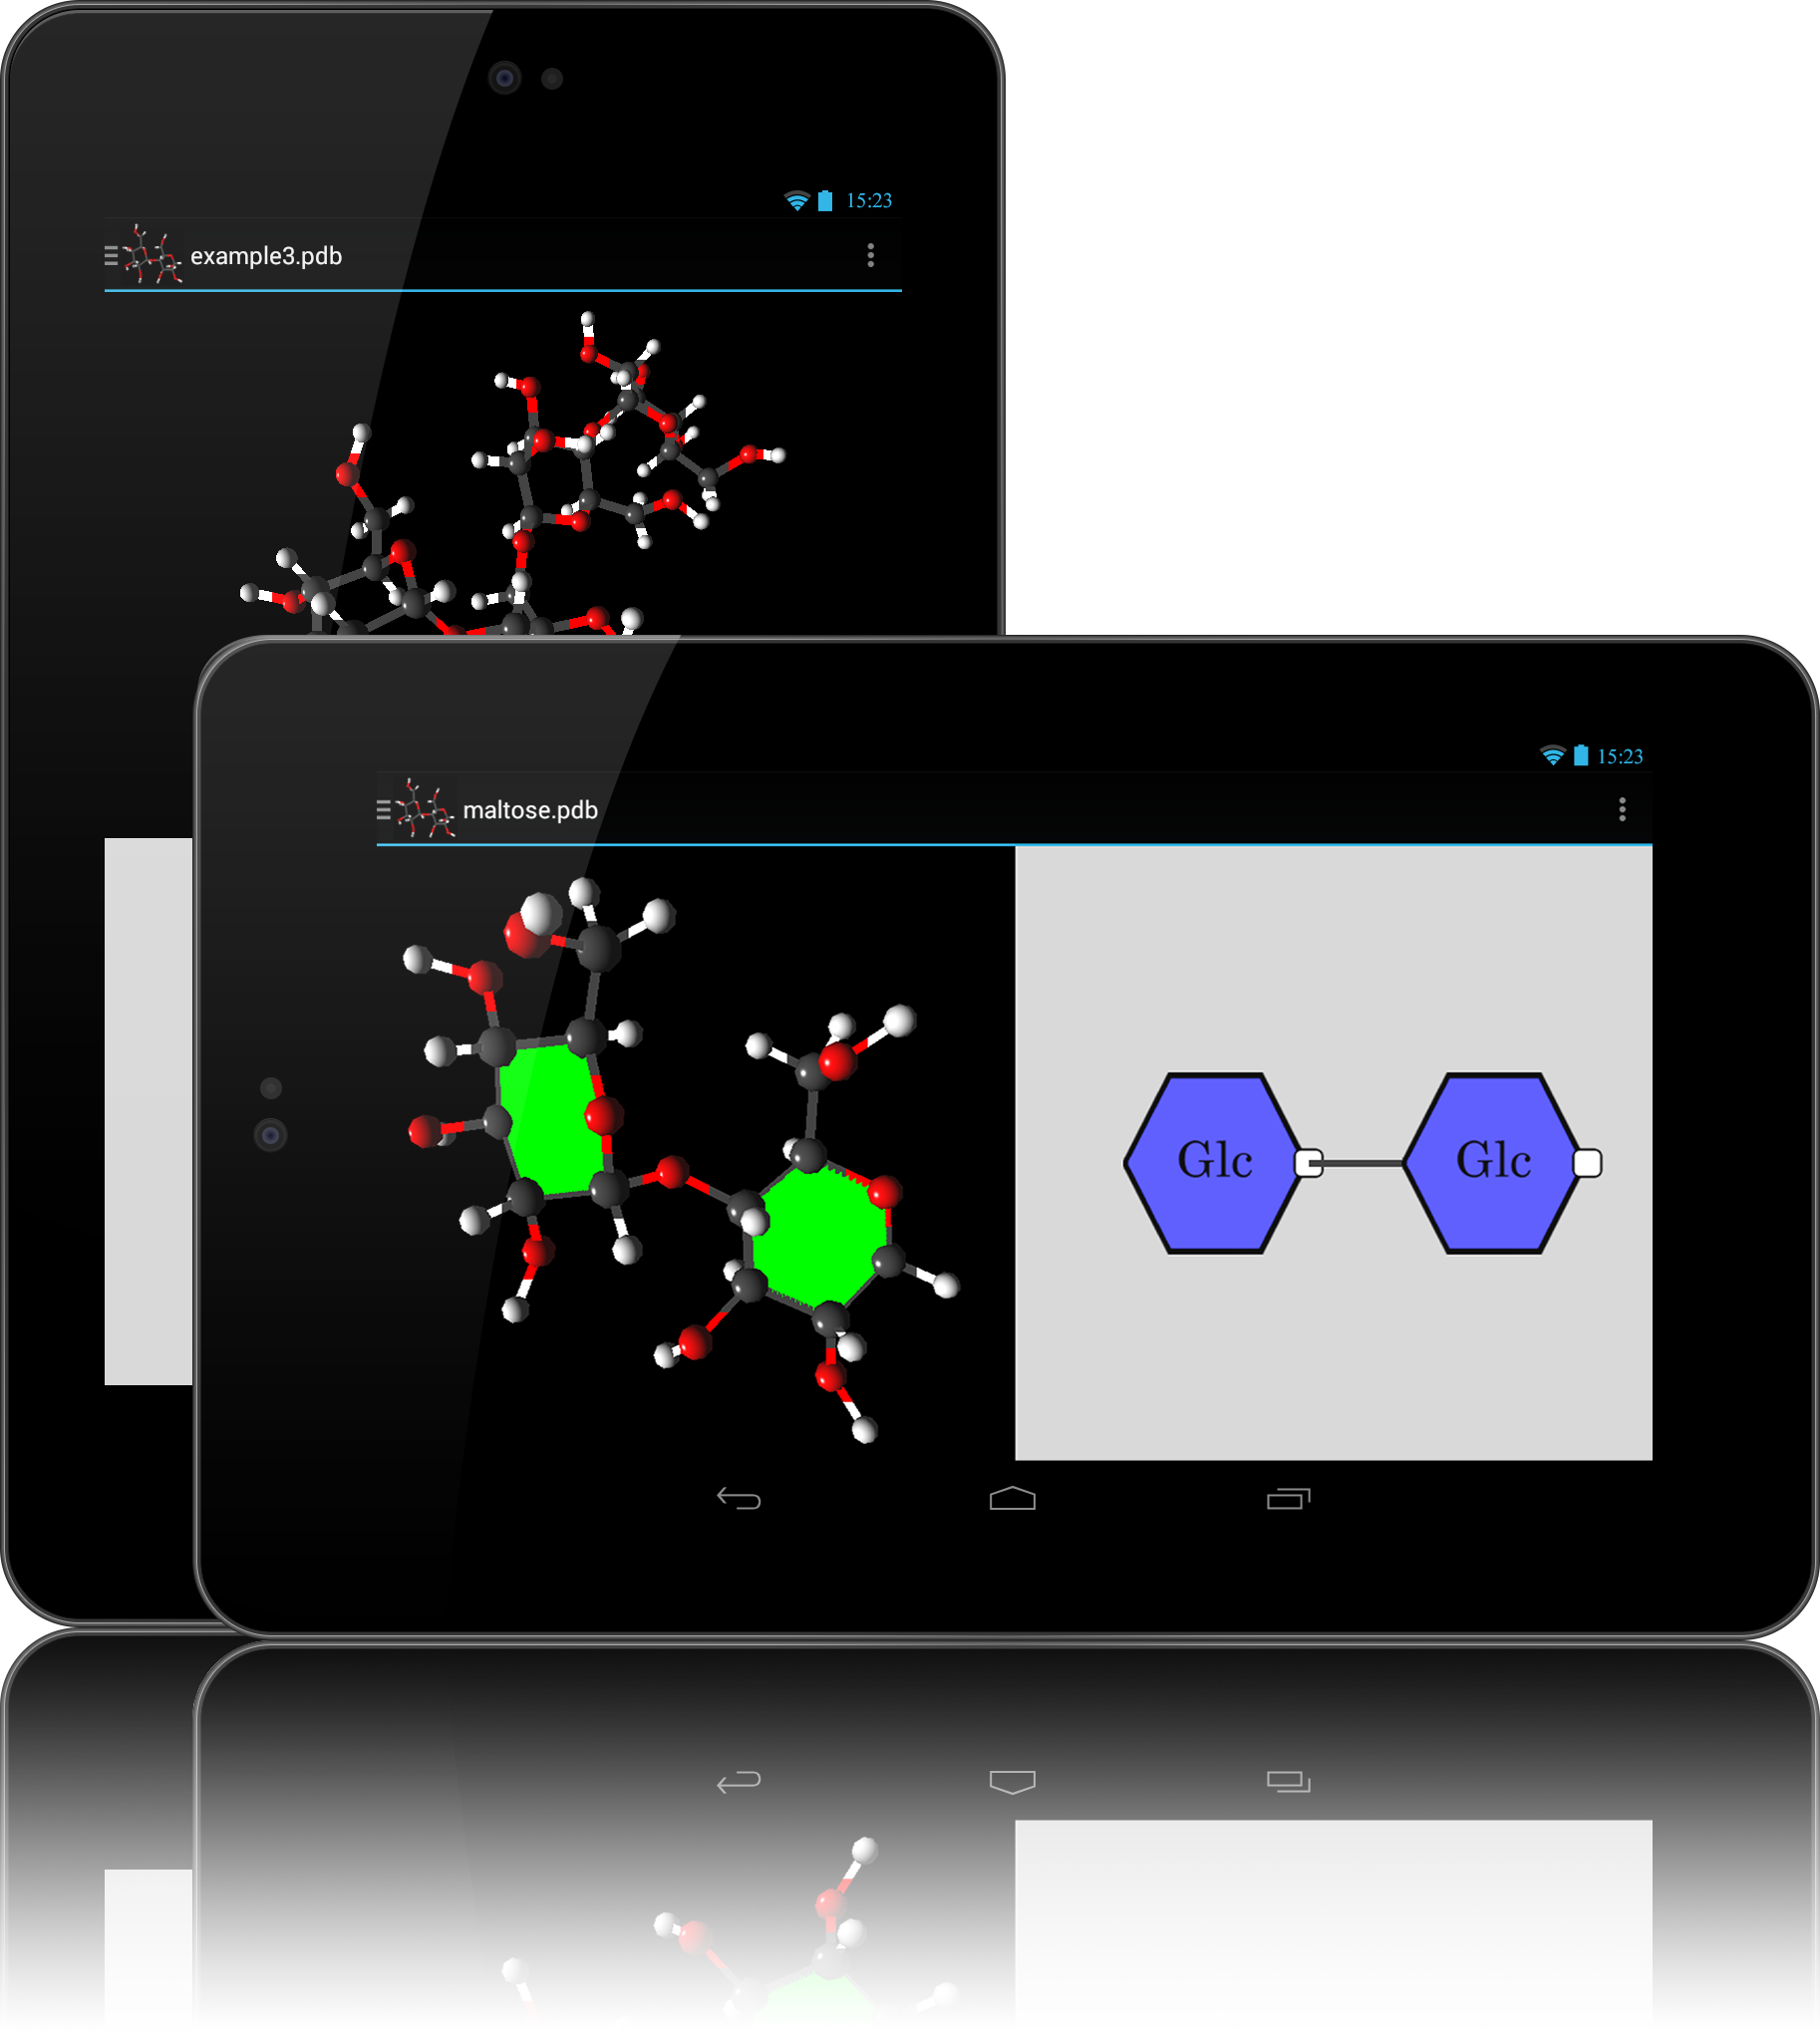
SweetTouch provides users with accurate 3D visualisations with the choice of a number of useful representations such as PaperChain while identifying monosaccharides and their interconnectivity.
The system architecture implemented in SweetTouch is shown below.
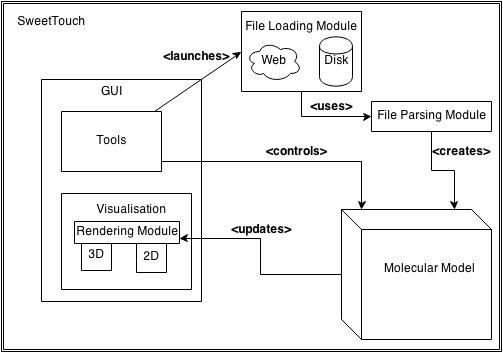 System Architecture Diagram
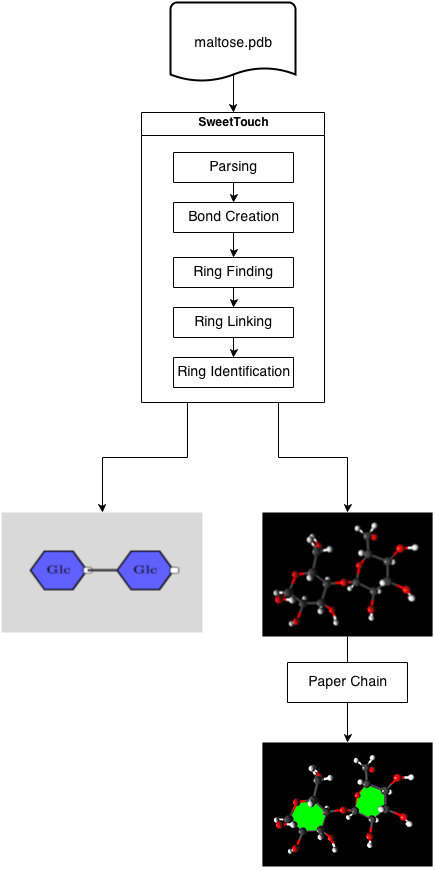 Flow of Processing
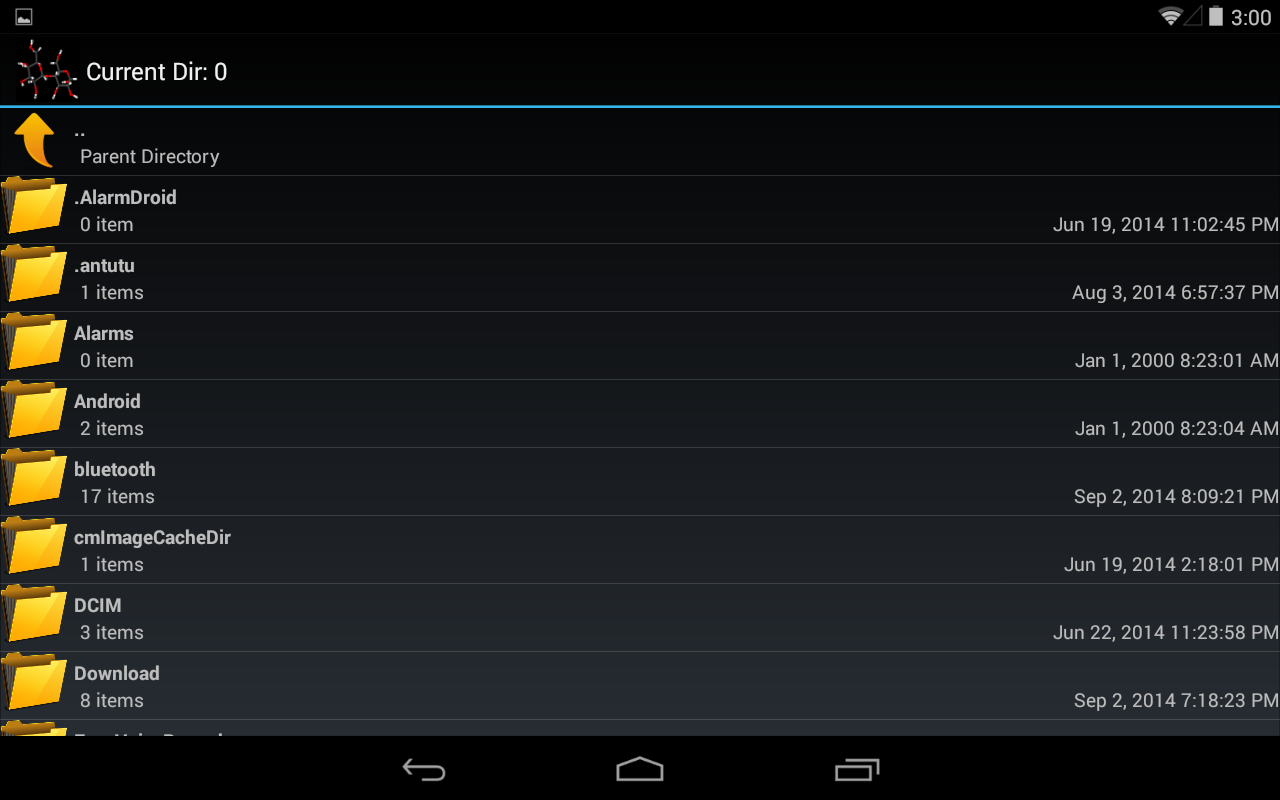
To begin, a user selects a PDB file containing molecular data. Once a file has been selected it parsed and atom information, such as 3D location, element, etc, is extracted. A molecular graph is now constructed where nodes represent atoms and edges represent the bonds between them. Bonds between atoms are found using their van de Waals radii. Once the molecular graph is constructed rings that have been formed are found and linked, at this stage the puckering of each ring is computed as well. Lastly monosaccharide identification takes place and the application can begin rendering.
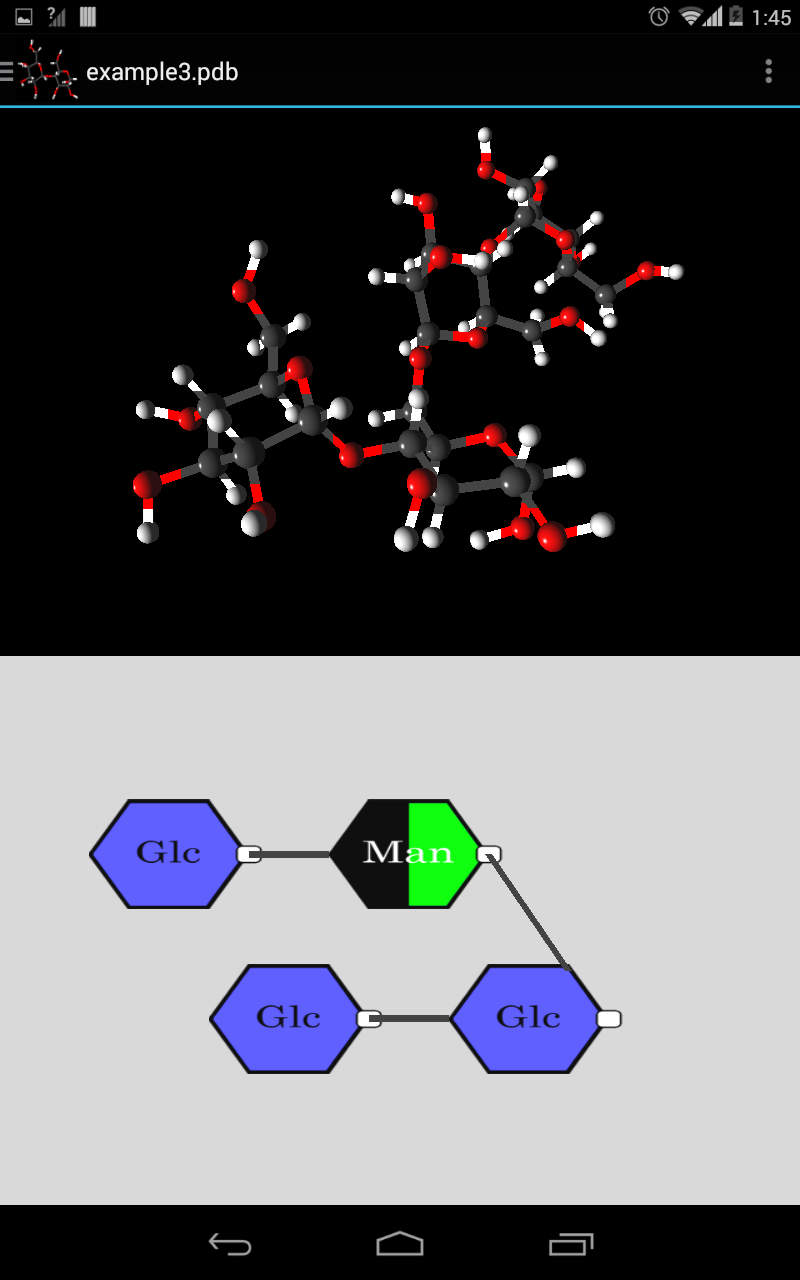
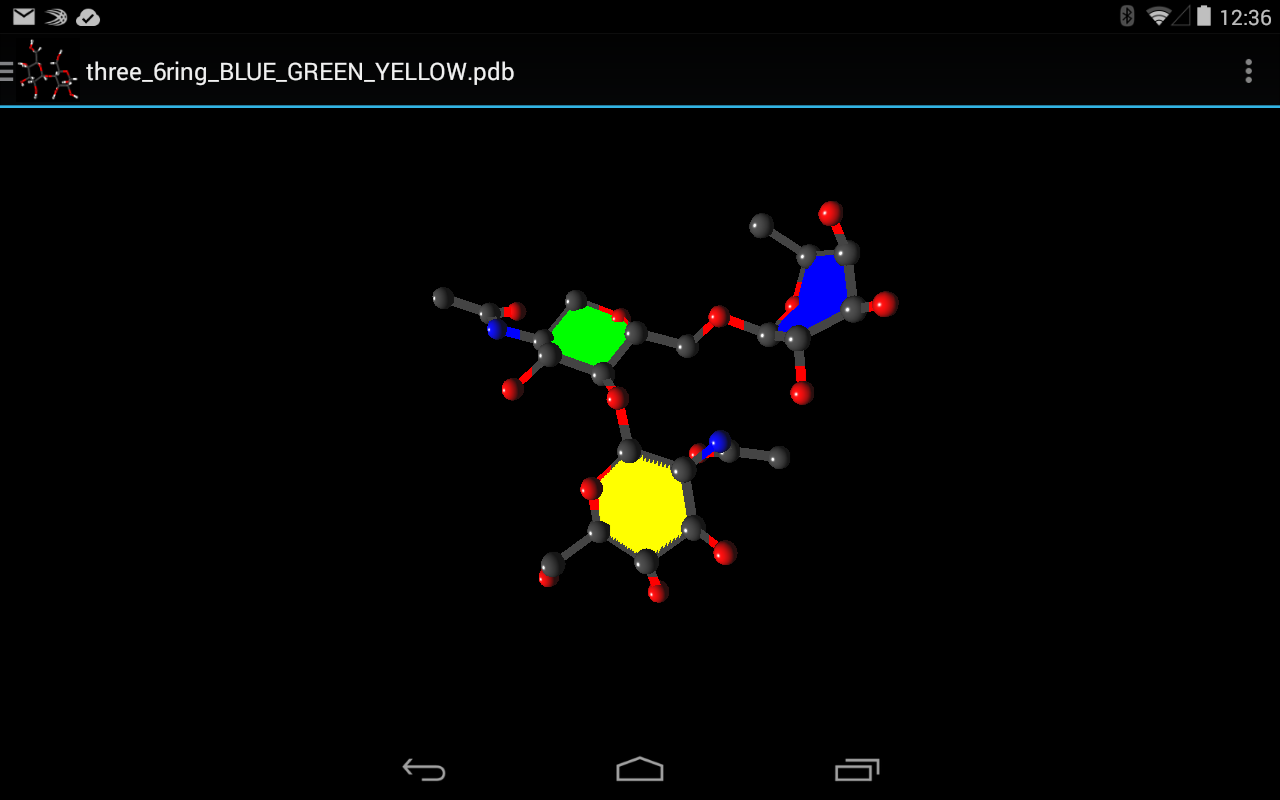
Once the monosaccharides in the carbohydrate molecular structure are found and identified through the process defined above, they need to be drawn to the screen in a meaningful way. The rings are depicted as regular polygons with the same number of vertices as there are atoms that form the ring. UCT provides its own monosaccharide colouring convention, and different types of rings (such as glucose or mannose) are coloured according to the UCT convention, with an abbreviation ("Glc" for glucose) overlayed over the polygon.
The polygons are first positioned on the screen relative to one another, then the links between them are drawn. Since each vertex of the polygon represents an atom in a ring, links between rings begin and end from the respective vertexes of the two polygons.
The scientific nature of SweetTouch implies that correctness is essential for it to be a useful application, thus most testing on the 2D section was to ensure accuracy of ring identification and display. SweetTouch correctly identifies monosaccharide rings in 100% of the test cases, and also showed itself to be resilient against a variety of false inputs.
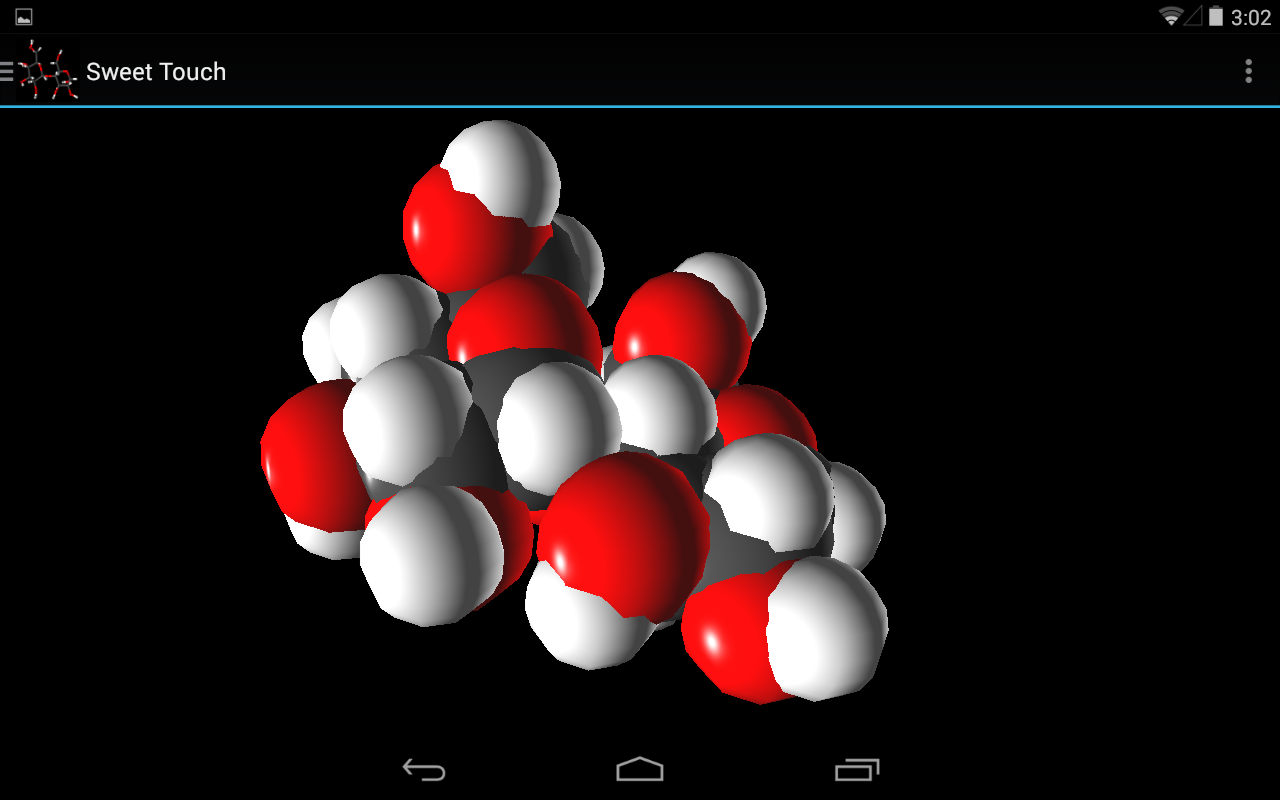
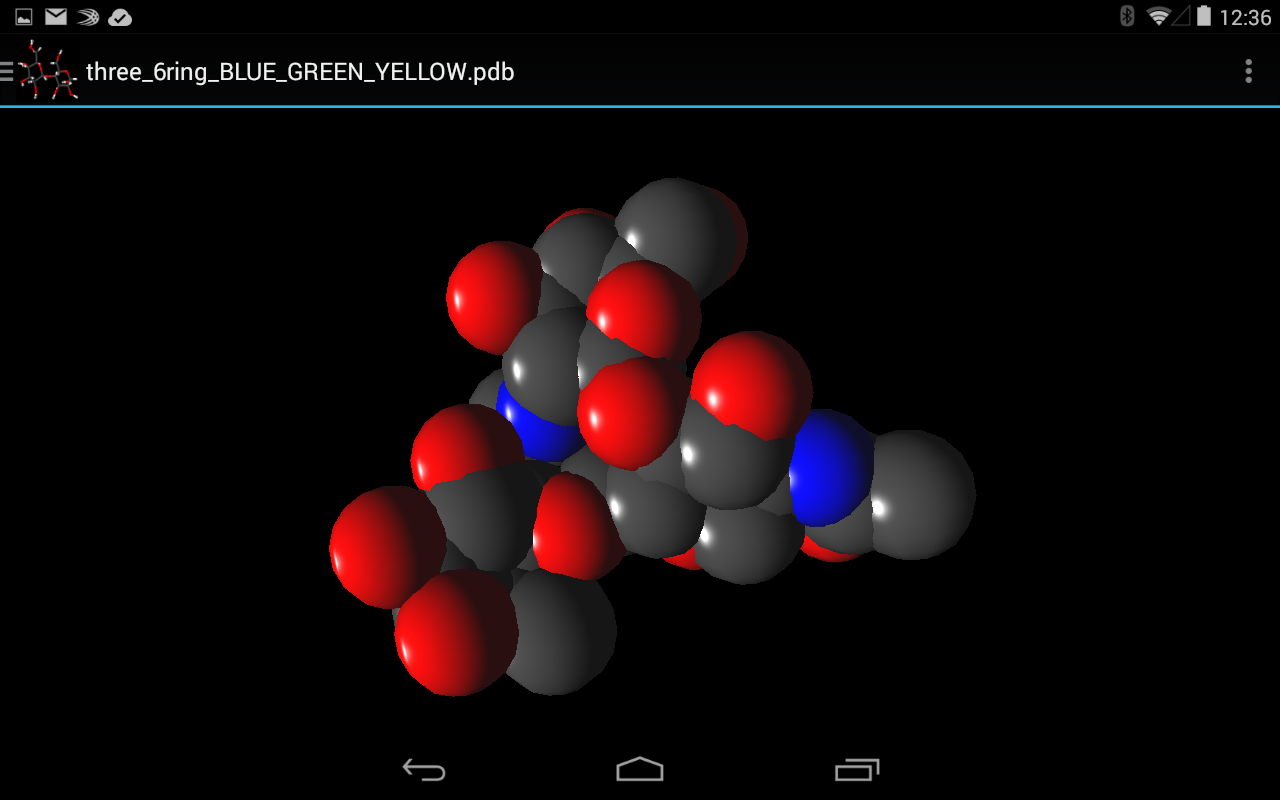
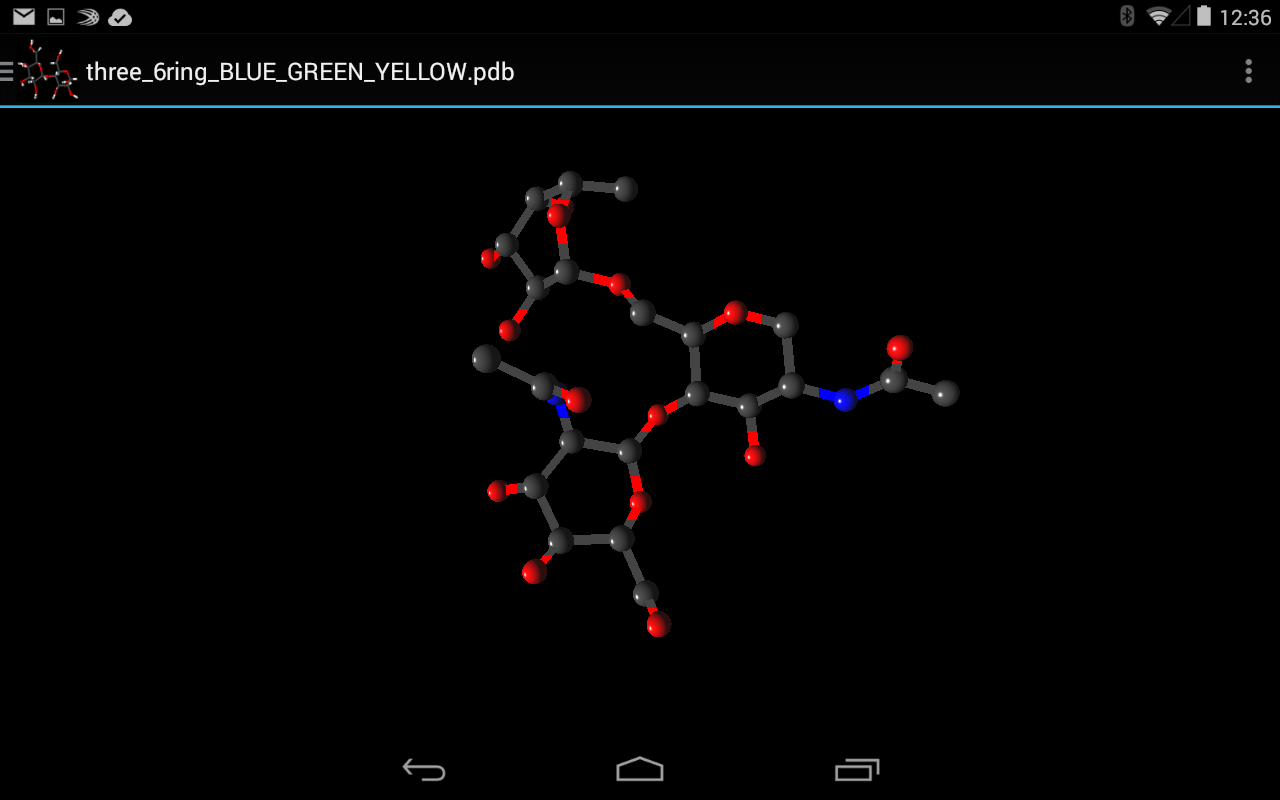
Once the processing described in System Architecture is complete the rendering stage can begin. Here spheres, which represent atoms, and 3D lines, which represent bonds are constructed for rendering. These elements allow for the rendering of the following representations: Ball-and-stick, Points, Sticks and CPK which all display only atoms, bonds or both. For the render of PaperChain the requisite planes are constructed as needed.
Both 3D rendering as well as the user interface underwent testing once complete to establish correctness and usability respectively For the rendering this was done both through testing of the underlying processing as well through comparing visualisations with results known to be correct. The user interface underwent both user testing and expert evaluation.
Testing proved the rendering of molecules to be correct. User testing results where also favourable with all users finding the application easy to use and 80% of users stating that they would use the application. User testing did however reveal that a large majority of users would have SweetTouch provide greater amounts of information. Expert testing isolated elements of the user interface that could be improved upon, while some of these where implemented, others remain as future work. Overall however, the user interface employed in SweetTouch was proved to be effective enough to allow full access to features.
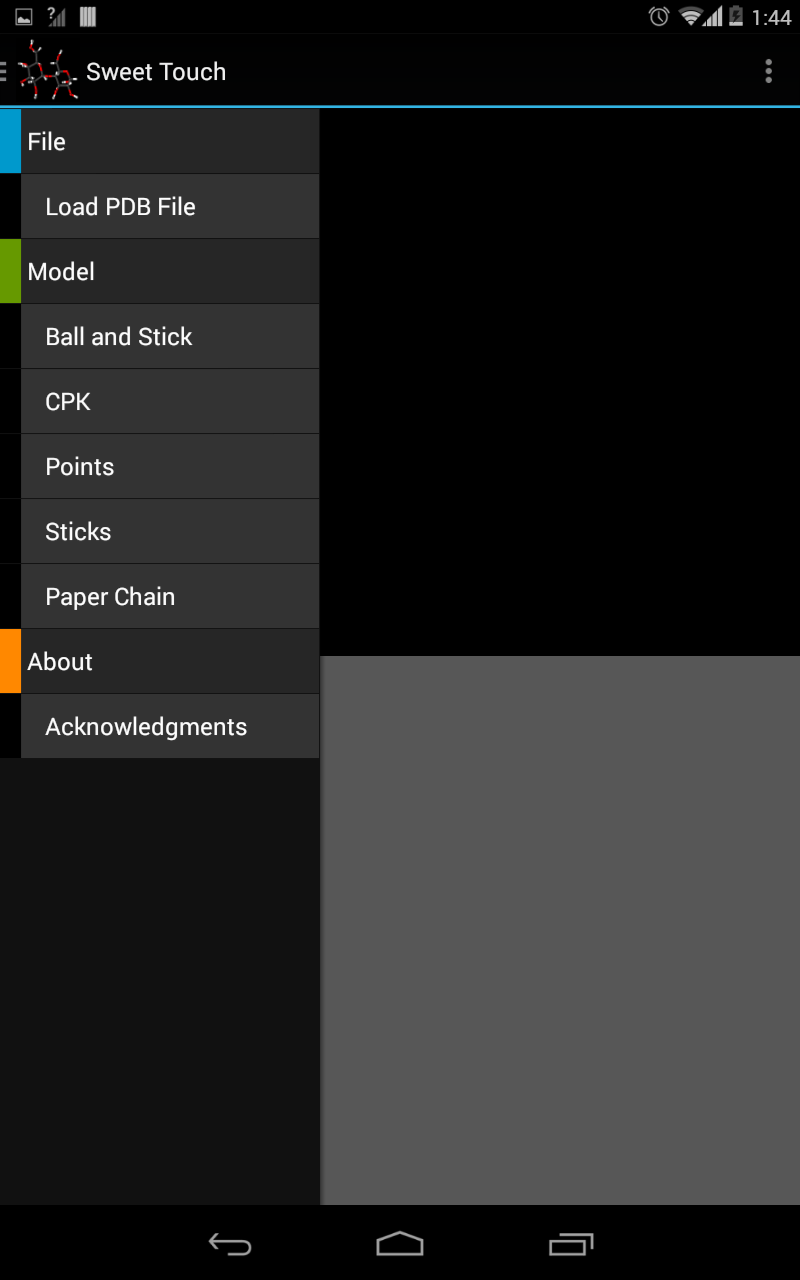
Screenshots

Downloads
SweetTouch
- Project Proposal
- Project Poster
- SweetTouch Git Repository
- SweetTouch Source Code
- SweetTouch on the Google PlayStore
- SweetTouch v1 APK
SweetTouch 2D (Wesley Robinson)
SweetTouch 3D (Mordechai Serraf)
The Team
 Michelle Kuttel (Supervisor)
 Wesley Robinson
 Mordechai Serraf